My Own Site, SEO Score 69 to 100: Before and After
3 min read
I put my own site through PageSpeed Insights one afternoon and the SEO column came back at 69. A security person whose own site gets a 69 from a free tool is not a good look. I spent a few days fixing everything that could be fixed, ran the same page again, and got SEO 100, accessibility 100, best practices 100, with mobile performance up from 66 to 87. Both sets of numbers are below.
Whose site these numbers come from
The measurements are from laisecure.com/en/, my own site, not a client case study. Publishing results from a client project needs written permission, and I have none I can post right now. The upside of using my own site is that I can explain every single change, including why I got it wrong in the first place.
The tool is Google PageSpeed Insights, and both runs cover the same URL in both the mobile and desktop modes. The copy and the services on the site did not change substantially over that period, so the movement in the scores can be put down to the technical work.
Before: healthy on desktop, poor on mobile
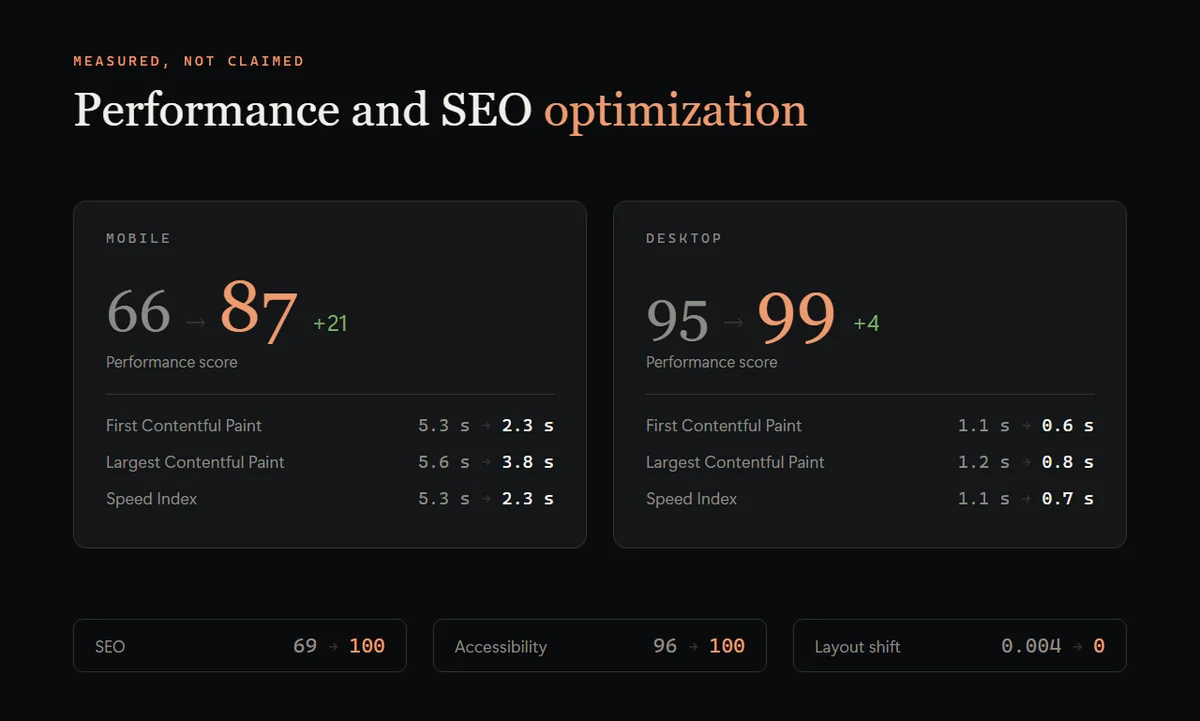
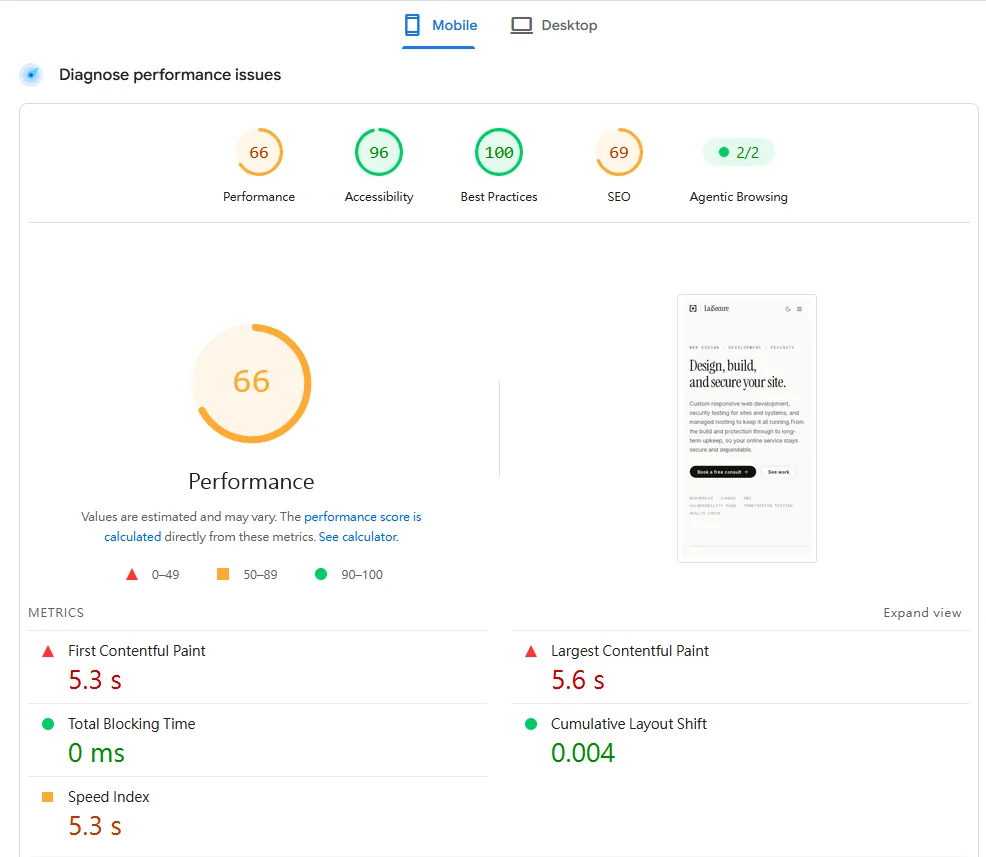
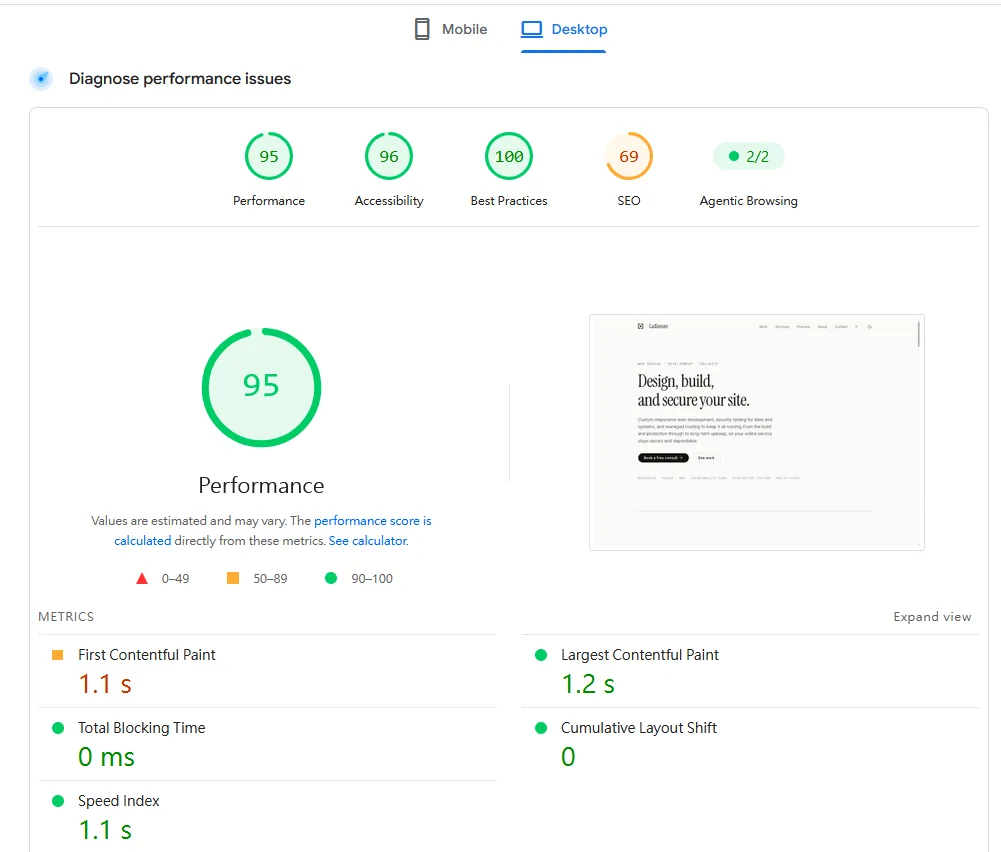
Mobile performance 66, SEO 69, first contentful paint 5.3 seconds, largest contentful paint 5.6 seconds. Desktop performance was 95, which hid the mobile problem completely. That is exactly why testing on desktop alone leaves people thinking nothing is wrong.
What I changed in between
The work fell into four groups. The first was basic page markup: one main heading per page, descriptions trimmed to a length search results will not cut off, and a sitemap that updates itself as content is added. The second was how the pages get produced, which now means every page is generated with its full text in place before it goes live, so search engines and AI engines read the whole thing without waiting for a browser to run any code. The third was adding machine-readable markup that states what the company is and whether a given page is an article or a set of questions and answers. The fourth was removing what dragged the load out: fonts moved onto my own server and cut back to the characters actually in use, images converted to a lighter format.
One outright bug surfaced along the way. The figures on the home page that count up from zero were frozen at their starting values in the document search engines actually receive, so it read "0 plugins reviewed" and "0 high-risk findings". Every piece of evidence on that page was zero as far as a machine was concerned. Nothing looked wrong on screen; the only way to catch it was to read the source.
After: the numbers
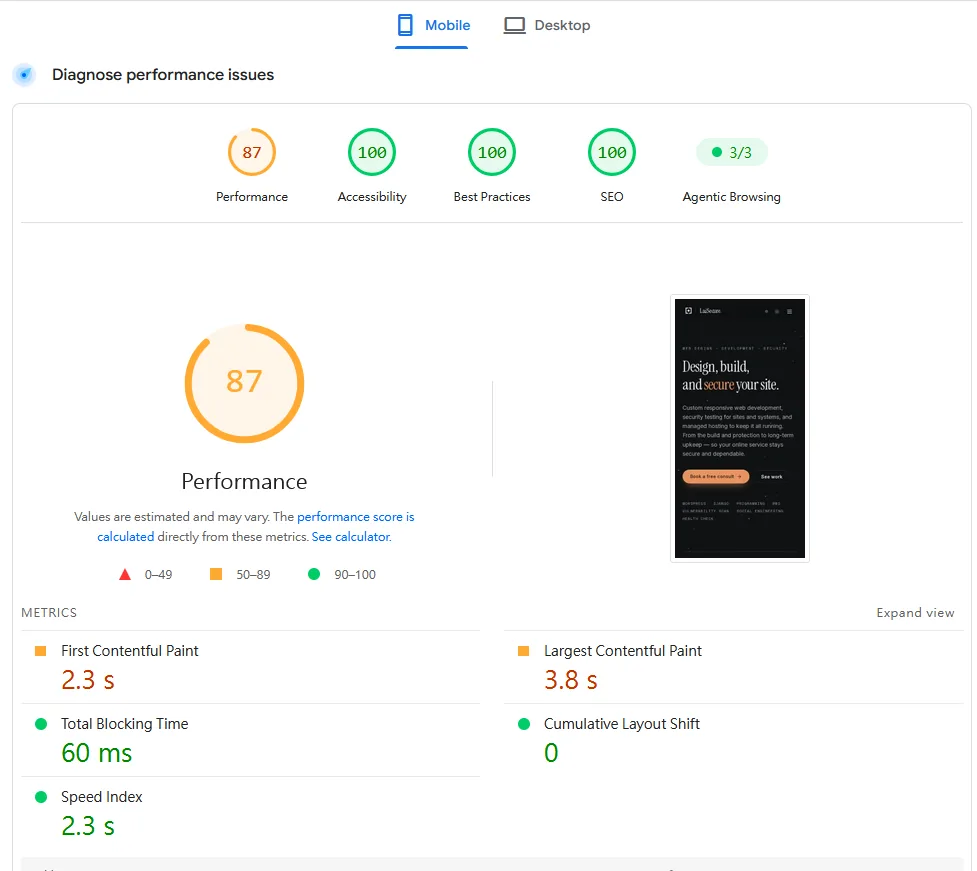
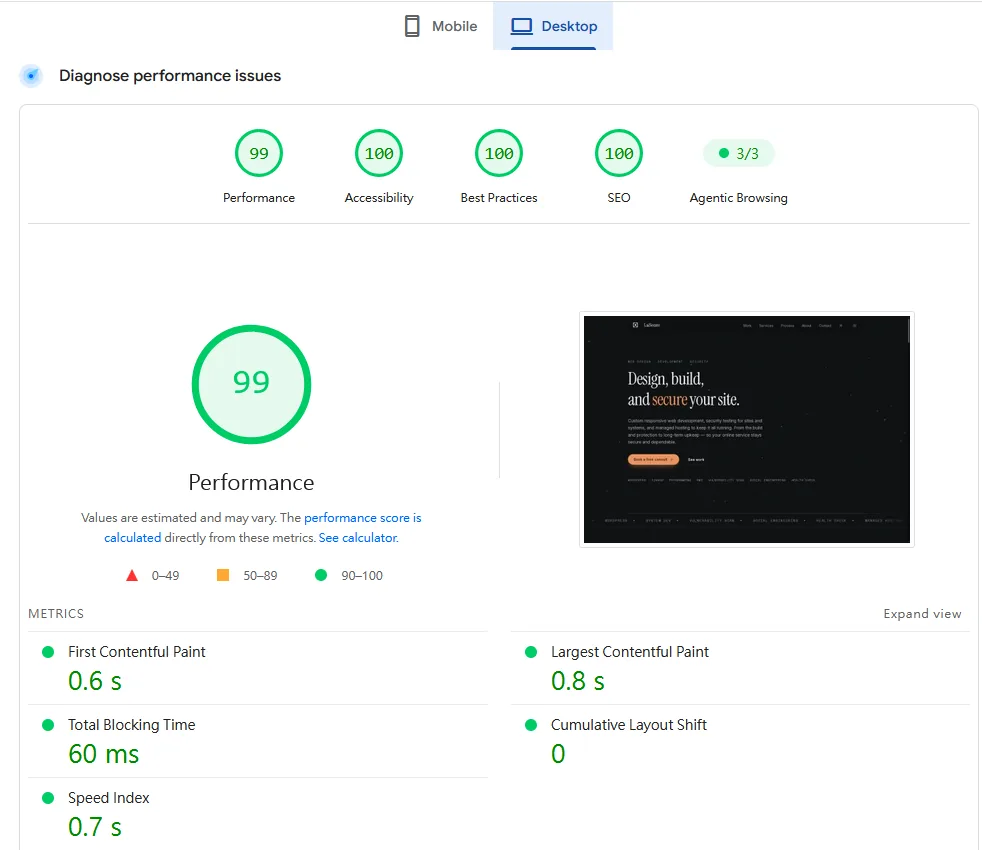
On mobile, first contentful paint went from 5.3 seconds to 2.3, largest contentful paint from 5.6 to 3.8, and cumulative layout shift from 0.004 to 0. The performance score moved from 66 to 87, and desktop from 95 to 99. SEO, accessibility and best practices all landed on 100, and the Agentic Browsing checks in PageSpeed Insights went from two of two passing to three of three. An LCP of 3.8 seconds is still above the 2.5 second guideline, so that one is not finished.
A score is not a ranking
An SEO score of 100 means a search engine can read the site: the headings have a structure, every page states which page it is, the sitemap is current, the content arrives without waiting for code to run, and the company details are labelled. That is a pass mark, and it is a separate thing from where you rank. Position is decided by the quality of the content, whether it answers what the person searching actually wanted, how many other sites mention you, and time. Technical fixes only move the obstacles out of the way.
Two more things to be straight about. Performance scores drift with the test environment, and the same code measuring five points apart a day later is completely normal, so SEO, accessibility and best practices are the three stable enough to sign work off against. And my own site does not carry much traffic, so what this proves is the effect of technical fixes, not a commercial result. Once I have long-run client data I am allowed to publish, that will be a separate piece.
If your site is stuck somewhere between 60 and 80, run PageSpeed Insights once and write down every item it marks down. Most of them will fall into four places: heading structure, meta descriptions, the sitemap and fonts. Some of those take minutes to fix. Others mean changing how the site is built.
Common questions
- If PageSpeed Insights gives my site 100 for SEO, will it rank well?
- No. That 100 means search engines can read your pages, which is the technical pass mark and nothing more. Position depends on whether the content answers the search intent, whether other sites cite you, and how long you have been accumulating that. Technical fixes clear obstacles rather than push you up.
- Does a React or Vue site need prerendering to do well in search?
- It is worth doing. Search engines can mostly run page code, but they queue it, and many AI engines only read the document the server sends first. Generating the text of every page before the site goes live means a machine gets the complete content on the first request, which helps both how fast you get indexed and how likely you are to be quoted.
- How long until SEO work shows a result?
- Technical changes usually show up in indexing status and the Search Console coverage report within one to two weeks. Keyword positions and traffic move on a three to six month horizon, and that depends on whether you keep publishing and keep picking up links from elsewhere.